Dividend Aristocrats
Dividends Companies in the S&P 500 that have grown their dividend for 25 years or more are called aristocrats. As of January 2025, 69 businesses meet this high standard. These companies are recognized for being financially strong, disciplined, and able to bounce back from setbacks. They often do better than the market when risk is taken into account.
List of Dividend Aristocrats September 2025
| Name | Yield Fwd Div | Consec Increases | 1 Yr Div CAGR | 5 Yr Div CAGR | EPS G / EPS FY1 | P/E FY1 | Net Debt/EBITDA | Payout Ratio | |
|---|---|---|---|---|---|---|---|---|---|
|
LEGGETT & PLATT, INC LEG | Stock | Common |
2.08% $0.20 |
0 yrs | -67.21% | -34.02% |
8.51% $1.15 |
8.4x | 2.7x | 17.43% | |
|
KIMBERLY-CLARK CORPORATION KMB | Stock | Common |
3.90% $5.04 |
0 yrs | 3.28% | 3.32% |
2.72% $7.73 |
16.7x | – | 65.24% | |
|
Farmers & Merchants Bancorp FMCB | Stock | Common |
1.92% $20.00 |
0 yrs | -20.99% | -0.62% |
– – |
– | – | 18.49% | |
|
3M COMPANY MMM | Stock | Common |
1.88% $2.92 |
1 yrs | -19.11% | -13.06% |
7.74% $8.53 |
18.2x | 1.7x | 34.24% | |
|
NUCOR CORPORATION NUE | Stock | Common |
1.48% $2.20 |
52 yrs | 1.38% | 6.41% |
27.85% $10.73 |
13.9x | 0.4x | 20.50% | |
|
The Gorman-Rupp Company GRC | Stock | Common |
1.73% $0.74 |
52 yrs | 2.07% | 4.63% |
14.53% $2.44 |
17.5x | 8.1x | 30.29% | |
|
MIDDLESEX WATER COMPANY MSEX | Stock | Common |
2.54% $1.36 |
52 yrs | 3.42% | 5.49% |
12.42% $2.76 |
19.4x | 5.2x | 49.28% | |
|
S&P Global Inc. SPGI | Stock | Common |
0.70% $3.84 |
53 yrs | 5.49% | 7.46% |
11.76% $19.25 |
28.5x | 1.7x | 19.95% | |
|
TENNANT CO TNC | Stock | Common |
1.44% $1.18 |
53 yrs | 3.96% | 5.80% |
12.85% $6.50 |
12.6x | 1.7x | 18.15% | |
|
BECTON, DICKINSON AND COMPANY BDX | Stock | Common |
2.16% $4.16 |
53 yrs | 6.94% | 5.39% |
3.32% $14.86 |
13.0x | 2.5x | 28.00% | |
|
Walmart Inc. WMT | Stock | Common |
0.97% $0.94 |
53 yrs | 13.25% | 5.48% |
12.53% $2.94 |
33.0x | 1.5x | 32.02% | |
|
AbbVie Inc. ABBV | Stock | Common |
3.12% $6.56 |
53 yrs | 5.81% | 6.81% |
18.34% $14.24 |
14.8x | 2.3x | 46.06% | |
|
ARCHER-DANIELS-MIDLAND CO ADM | Stock | Common |
3.26% $2.04 |
53 yrs | 2.00% | 7.21% |
19.04% $4.74 |
13.2x | 2.4x | 43.06% | |
|
PepsiCo, Inc. PEP | Stock | Common |
3.83% $5.69 |
54 yrs | 5.49% | 6.93% |
5.74% $8.48 |
17.5x | 2.3x | 67.08% | |
|
ABBOTT LABORATORIES ABT | Stock | Common |
1.78% $2.36 |
54 yrs | 5.36% | 9.05% |
10.23% $5.67 |
23.4x | 0.5x | 41.60% | |
|
Canadian Utilities Ltd. – Ordinary Shares – Class A CDUAF | Stock | Common |
4.78% $1.33 |
54 yrs | 1.02% | 1.00% |
3.76% $1.80 |
15.5x | – | 73.96% | |
|
LOWE’S COMPANIES, INC. LOW | Stock | Common |
1.86% $4.80 |
54 yrs | 4.40% | 15.61% |
7.78% $13.25 |
19.5x | 2.2x | 36.21% | |
|
KIMBERLY-CLARK CORPORATION KMB | Stock | Common |
3.51% $5.04 |
54 yrs | 3.28% | 3.32% |
7.53% – |
18.8x | 2.5x | 61.02% | |
|
TARGET CORPORATION TGT | Stock | Common |
4.75% $4.56 |
55 yrs | 1.80% | 11.02% |
8.71% $7.95 |
12.1x | 2.0x | 57.33% | |
|
PPG INDUSTRIES, INC. PPG | Stock | Common |
2.55% $2.84 |
55 yrs | 4.51% | 5.77% |
8.79% $8.57 |
13.0x | 3.2x | 33.13% | |
|
Black Hills Corporation BKH | Stock | Common |
4.52% $2.70 |
55 yrs | 4.00% | 4.50% |
5.72% $4.35 |
13.8x | 6.4x | 62.23% | |
|
W.W. Grainger, Inc. GWW | Stock | Common |
0.89% $9.04 |
55 yrs | 10.24% | 8.25% |
11.29% $44.08 |
23.0x | 1.1x | 20.51% | |
|
UNIVERSAL CORPORATION UVV | Stock | Common |
5.86% $3.28 |
56 yrs | 1.24% | 1.27% |
-2.74% $4.61 |
12.1x | 4.1x | 71.15% | |
|
MSA SAFETY INCORPORATED MSA | Stock | Common |
1.24% $2.12 |
56 yrs | 5.00% | 4.19% |
11.04% $8.77 |
19.5x | 1.5x | 24.17% | |
|
NATIONAL FUEL GAS COMPANY NFG | Stock | Common |
2.47% $2.14 |
56 yrs | 3.92% | 3.67% |
24.84% $8.61 |
10.1x | 2.4x | 24.85% | |
|
ILLINOIS TOOL WORKS INC ITW | Stock | Common |
2.43% $6.44 |
56 yrs | 7.24% | 7.07% |
7.57% $11.21 |
23.6x | 1.7x | 57.46% | |
|
Sysco Corporation SYY | Stock | Common |
2.68% $2.16 |
57 yrs | 4.93% | 3.42% |
2.92% $4.59 |
17.5x | 3.2x | 47.06% | |
|
STEPAN COMPANY SCL | Stock | Common |
3.08% $1.54 |
57 yrs | 1.99% | 6.39% |
66.18% $4.01 |
12.5x | 1.3x | 38.45% | |
|
H.B. Fuller Company FUL | Stock | Common |
1.54% $0.94 |
57 yrs | 6.30% | 7.45% |
13.67% $4.78 |
12.8x | 4.2x | 19.67% | |
|
ALTRIA GROUP, INC. MO | Stock | Common |
6.31% $4.24 |
57 yrs | 4.00% | 4.12% |
3.15% $5.60 |
12.0x | 2.0x | 75.71% |
What Makes a Company a Dividend Aristocrat?
A corporation must meet the following requirements to be a Dividend Aristocrat:
- Be on the S&P 500 list
- Raise its dividend for more than 25 years in a row
- Meet the minimum size and liquidity requirements.
Why are Dividend Aristocrats important to investors?
Investors like Dividend Aristocrats because they provide steady income and are strong in the market.
Main Benefits:
- Steady Income: Annual increases in dividends make cash flow predictable.
- Protection against inflation: Dividend growth helps keep your buying power.
- Stability in Times of Trouble: These businesses do better than others during recessions.
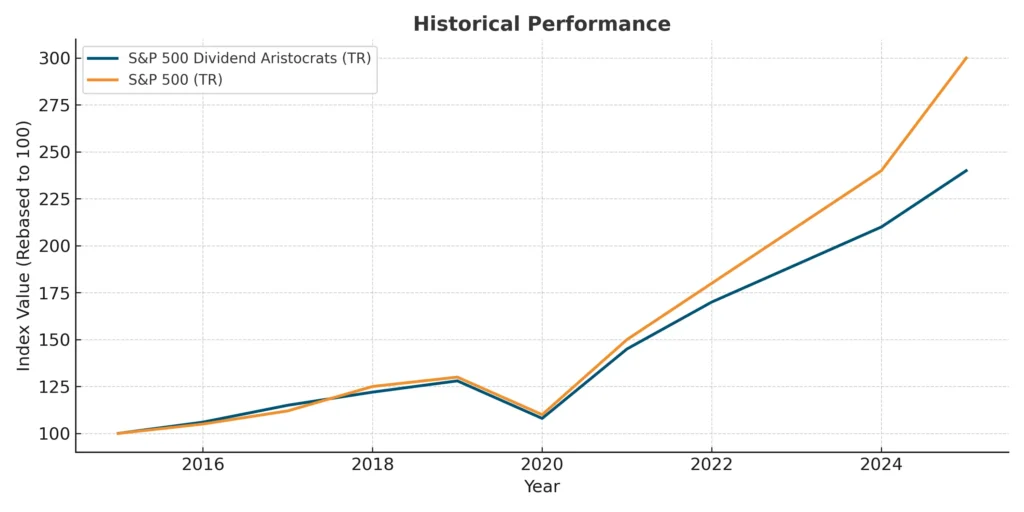
- Less Risk: The NOBL ETF had a lower risk than the S&P 500 and returned 10.0% a year from 2015 to 2025.
- Wealth Compounding: Putting dividends back into the stock market increases long-term returns.
Sector Breakdown of Dividend Aristocrats (2025)
The 69 companies span multiple industries, but some sectors dominate.
| Sector | % of Index | Examples |
| Industrials | 23.3% | Dover Corp, 3M |
| Consumer Staples | 21.4% | PepsiCo, Procter & Gamble |
| Financials | 13.2% | Cincinnati Financial, Erie Indemnity |
| Real Estate (REITs) | ~4% | Realty Income, Federal Realty Trust |
- Walmart is the largest Dividend Aristocrat ($793B market cap).
- Federal Realty Trust is the smallest ($7.9B).
Examples of Notable Dividend Aristocrats
These companies showcase why Aristocrats are trusted for long-term investing:
- Target Corp. (TGT) – 2,000+ stores; strong private-label growth strategy.
- Dover Corp. (DOV) – Diversified industrial with 35 years of dividend increases.
- Cincinnati Financial (CINF) – Property and casualty insurer; 26 years of dividend hikes.
- Genuine Parts Co. (GPC) – Runs 1,700+ NAPA stores; 35 years of dividend growth.
- PepsiCo (PEP) – Global consumer brands in 200+ countries; strong cash flows.
How to Invest in Dividend Aristocrats
You can access Aristocrats in two main ways:
1. Individual Stocks
Buy specific companies you understand.
Screen by valuation (e.g., low P/E or PEG ratio).
2. Exchange-Traded Funds (ETFs)
The ProShares S&P 500 Dividend Aristocrats ETF (NOBL) holds all 69 firms.
Offers instant diversification but may lag in bull markets.
What Makes Dividend Aristocrats Unique in 2025?
Dividend Aristocrats stand out for:
- Long-term dividend consistency
- Exposure to high-quality sectors
- History of outperforming with less volatility
Despite representing only a small portion of U.S. stocks, they offer income reliability and portfolio resilience that many investors seek.
Other Dividend Reinvestment Calculator
- SCHD Dividend Calculator
- JEPI Dividend Calculator
- JEPQ Dividend Calculator
- Voo Dividend Calculator
- QYLD Dividend Calculator
- SPY Dividend Calculator
- Coca-Cola Dividend Calculator
Also check Yieldmax Dividend Announcement today august 2025 latest,