JEPI Dividend Calculator
A lot of people who want monthly dividend income like the JPMorgan Equity Premium Income ETF (JEPI).
| Year | Start Balance | Start Shares | Share Price | Dividend/Share | Annual Dividend | Total Dividends | End Shares | End Balance |
|---|
JEPI is an options-based technique to get a larger dividend return than other regular ETFs.
You may use our JEPI Dividend Calculator to figure out how much money you can make in dividends each month and each year based on how much you invest, the share price, and the dividend yield. You can also use cash distributions or dividend reinvestment (DRIP) to guess how much your business will grow in the future.
Use the JEPI Dividend Calculator
The JEPI Dividend Calculator is for investors who want to know exactly how much money they will make. It helps you plan with confidence by using the most recent market data and inputs that you can change.
Key Features:
- Annual and Monthly Dividend Income: You can quickly figure out how much money you can anticipate to get back from your investment.
- Compare DRIP with cash: Find out how dividend reinvestment (DRIP) can help your portfolio develop compared to getting cash dividends.
- You can change the share price, dividend yield, and investment amount to fit your portfolio.
Please fill out the form below. You can either reinvest dividends or get cash. The calculator will show you how much money you might make and how much it might grow over time.
Give it a try now and feel sure about your dividend plan.
Compare JEPI vs Other Dividend ETFs or Stocks
If you know how JEPI compares to other ETFs that focus on dividends, you can make better investment choices. You can see a side-by-side comparison of SCHD, one of the most popular dividend ETFs, and then you can compare it to any stock or ETF you like.
JEPI vs SCHD – Which is Better for Dividend Income?
Here’s how JEPI compares with SCHD on key metrics:
| Metric | JEPI | SCHD |
| Dividend Yield (2025) | 8.5% (monthly payouts) | 3.6% (quarterly payouts) |
| Payout Frequency | Monthly | Quarterly |
| Annual Dividend Income (per $10k invested) | $850 | $360 |
| Expense Ratio | 0.35% | 0.06% |
| Total Return (5 years) | 38% (income-heavy strategy) | 52% (more growth potential) |
Total return includes price appreciation and reinvested dividends.
- JEPI offers higher dividend income and more frequent payouts.
- SCHD has a lower expense ratio and may deliver more long-term capital growth.
- Choose based on your income needs, risk tolerance, and time horizon.
Should You Buy JEPI for Dividend Income?
For certain investors, JEPI is a great alternative, but not for all of them. Here’s what an expert says:
Who Could Use JEPI?
- Investors who demand continuous cash flow are drawn to JEPI’s high monthly dividend yield.
- Retirees: A monthly income can help pay for living costs without having to sell shares.
- Balanced Portfolios: JEPI can help investors who already own growth-focused ETFs or stocks by adding variety.
Key Considerations Before Investing
- Income Stability: JEPI’s yield is attractive but can fluctuate based on market conditions and option premiums.
- Capped Growth: The covered call strategy may limit upside potential during strong bull markets.
- Risk Factors: JEPI is not risk-free. Market downturns and option losses can affect returns.
- Tax Considerations: Monthly payouts may result in higher tax obligations, especially in taxable accounts.
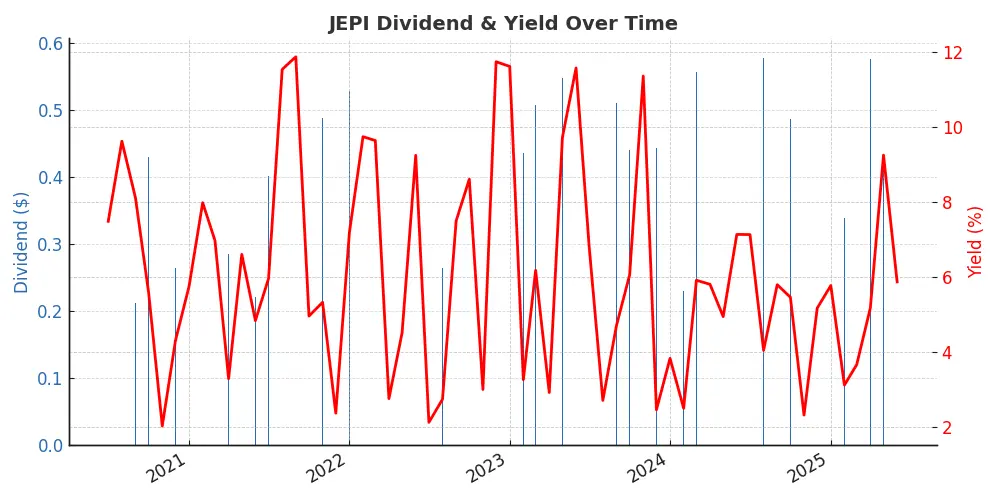
JEPI Dividend Stats & Key Metrics
Here is a quick overview of JEPI’s most important metrics. These figures update automatically using the latest data from trusted financial sources.
| Metric | Value (Latest) |
| Dividend Yield | 8.5% |
| Annualized Dividend Payout (per share) | $4.92 |
| Payout Frequency | Monthly |
| Expense Ratio | 0.35% |
| Market Price | $57.85 |
| Net Asset Value (NAV) | $57.70 |
| Total Assets | $30.4 billion |
| Inception Date | May 2020 |
Other Dividend Reinvestment Calculator
- SCHD Dividend Calculator
- JEPI Dividend Calculator
- JEPQ Dividend Calculator
- Voo Dividend Calculator
- QYLD Dividend Calculator
- SPY Dividend Calculator
- Coca-Cola Dividend Calculator
Also check Yieldmax Dividend Announcement today august 2025 latest,
FAQ’s
Disclaimer:
This page’s numbers and computations are only guesses and may not show how things will go in the future. This information is not financial advice; it is only for educational purposes. Before you make any investing decisions, you should always talk to a licensed financial professional.
This tool gets new information from JPMorgan, Nasdaq, and MarketBeat on a regular basis. This makes sure that your results are based on the current state of the market.