QYLD Dividend Calculator
The QYLD Dividend Calculator lets you quickly estimate monthly and annual income from the Global X NASDAQ 100 Covered Call ETF (QYLD)
Daily Income
Monthly Payout
Yearly Yield
Quarterly Income
Current QYLD Dividend Stats
Dividend Yield
Annual Dividend
Dividend Growth
Cons. Yrs Paid
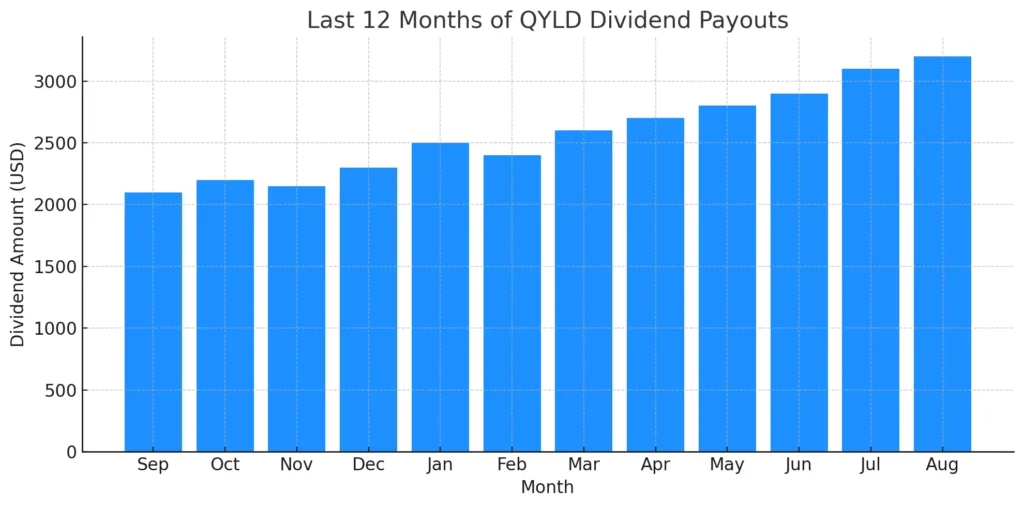
QYLD Dividend History
Here is QYLD’s dividend history for the last 24 months. This helps investors track consistency and yield fluctuations.
| Month | Dividend per Share ($) | Yield at Payment (%) |
| Jan 2024 | 0.17 | 11.2% |
| Dec 2023 | 0.16 | 11.1% |
| Nov 2023 | 0.17 | 11.3% |
Average Payout: $0.16–$0.18 per share monthly
Annualized Yield: Generally 10%+
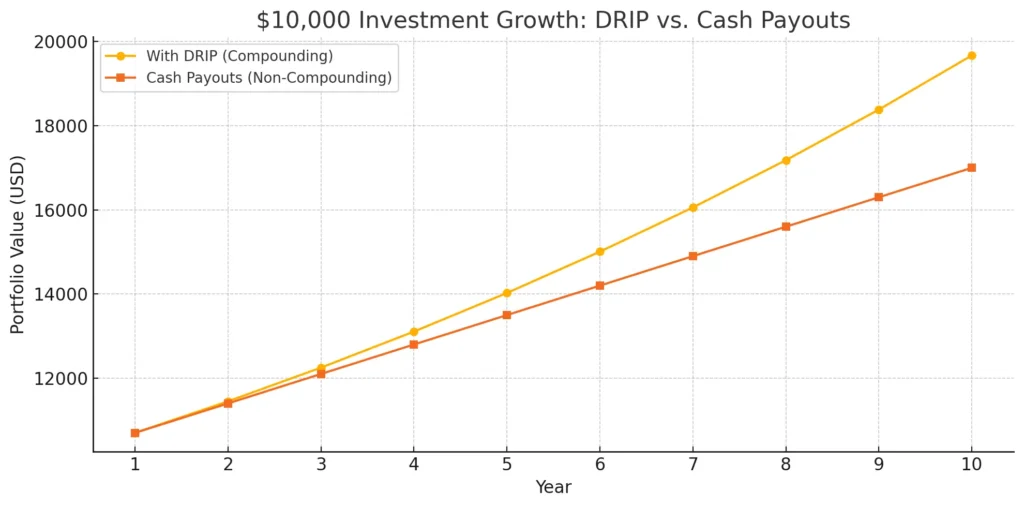
Future Dividend Projections
The calculator can project 5–10 years of future dividends. These are based on:
- Current yield and share price
- Your investment amount
- Whether you choose DRIP or cash payouts
Factors Affecting Future Dividends:
- Market volatility
- Covered call option premiums
- Changes in dividend policy by Global X Funds
Disclaimer: Projections are estimates, not guarantees. Dividend amounts may change.
Other Dividend Reinvestment Calculator
- SCHD Dividend Calculator
- JEPI Dividend Calculator
- JEPQ Dividend Calculator
- Voo Dividend Calculator
- QYLD Dividend Calculator
- SPY Dividend Calculator
- Coca-Cola Dividend Calculator
Also check Yieldmax Dividend Announcement today august 2025 latest,
Key Facts About QYLD ETF
- Fund Manager: Global X Funds (Mirae Asset Global Investments)
- Investment Strategy: Covered call ETF on the Nasdaq 100
- AUM: $X billion
- Expense Ratio: 0.60%
- Inception: December 11, 2013
- Payout Frequency: Monthly
Benefits & Risks of Investing in QYLD
Benefits
- High monthly income
- Strong dividend yield
- Reinvestment (DRIP) can compound returns
- Diversified Nasdaq 100 exposure
Risks
- Limited upside in bull markets
- Payouts can fluctuate
- Higher tax liability for some investors
- Expense ratio is higher than broad index ETFs
Compare QYLD With Other Dividend ETFs
FAQ’s QYLD Dividend Calculator
Data Sources & Disclaimer
All data is pulled from Global X Funds, MarketBeat, and Nasdaq.
Disclaimer: QYLD Dividend calculator and all projections are for informational purposes only. They are not investment advice.